About
The International Dividend Portfolio objective is to generate dividend income every month, based on international dividend growth stocks and over the long-term preserve and grow the invested capital. The total return is expected to follow the MSCI World index and a dividend growth rate between 4%-9%.
Holdings are rarely sold as long as dividend pay-outs are not cut and managed with a “buy-and-hold investor” mind-set. The International Dividend Portfolio contains mainly US and European stocks, so mature markets, but the related companies will often have exposure to emerging markets as well.
Getting started
We created the International Dividend Portfolio, so customers can follow a selection of international dividend stocks. Some investors could mirror the portfolio holding for holding, but others use the list to generate investment ideas and make sense of trends and risk/returns in their own portfolios.
If you decide to mirror the portfolio, our recommendation would be to invest equally across all holdings. This provides diversification between stocks, sectors, and currencies. Preferable the value of one individual stock is always below 5%-8%. Some holdings may appear undervalued and some overvalued, so we provide some guidelines/rules when to buy or not to buy. Please take into account that there is currency risk.
More details and the dividend stocks in portfolio are available to members.
Key Metrics
In 2009 the virtual International Dividend Model Portfolio started with €100,000 or $ 140,000 ,10 US dividend stocks and 5 European dividend stocks.
The holdings value grew with 15.5% annually year (CAGR) in euros and 13.2% in dollars, as you can see in the table below. Due to currency fluctuation, the European investor benefited more from the dollar holdings.
| Holdings Value (€) | Holdings Value ($) | |
| Start 2009 | € 100,000 | $ 140,000 |
| End 2017 | € 378,000 | $ 454,000 |
| End 2018 | € 385,000 | $ 441,000 |
| End 2019 | € 487,797 | $ 547,162 |
| End 2020 | € 489,242 | $ 600,300 |
Also, the goal of a dividend growth rate between 4%-9% has been accomplished, since the average dividend growth rate of this portfolio has been 9.6% in euros and 7.2% in dollars.
Please note that re-investing the dividends received would result in higher performance. (the power of dividends and compounding)
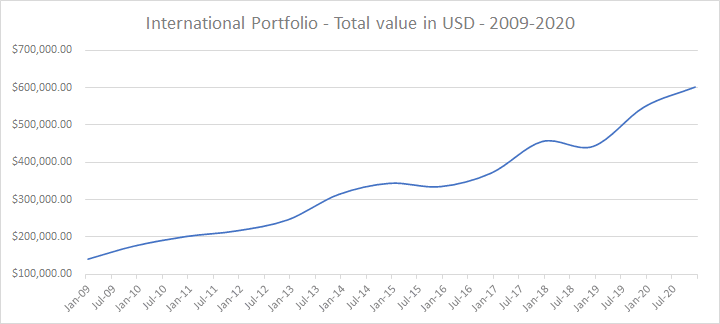 Figure 1: Performance International Dividend Portfolio 2009-2020

Since its inception in 2009, the portfolio has returned 330% in US$ and 389% in €, excluding reinvesting dividends.
Calendar Year Performance
Our International Dividend Portfolio objective is to generate dividend income every month, based on international dividend growth stocks and over the long-term preserve and grow the invested capital. The total return is expected to follow the MSCI World index and to aim for a dividend growth rate between 4%-9%.
Looking back on the last 11 years, the dividend growth rate is on average 7.2% and the annualized return for this period is 13.2%, while the MSCI World index returned 10.08%.
See below how the annualized returns (CAGR) have evolved over time.
